Data Studio Validation Guide
Loft47 Data Studio is an advanced reporting and analytics tool built to meet the specific reporting needs of individual brokerages.
This guide outlines how to validate the data displayed in Data Studio against Loft47 exports and explains any expected variances.
Data Studio contains the following reporting categories:
Example: This validation compares written deal data between Data Studio Report and Loft Performance Report for the month of January.
In Data Studio > #6. Written Report > Export Data
Data Studio Export Report shown as below:
Now apply the following filters in Loft Performance Report - we will need one for written and one for closed payout.Step 2: Generate Performance Report for written unpaid data:
Viewing - Pending History
Date Scope - Created at January
Ranking - Sales Volume
These filters return all unpaid (written) deals created during January. Generate Report and/or download it as xls.
Now apply the following filters in Loft Performance Report - we will need one for written and one for closed payout.
These filters return all unpaid (written) deals created during January. Generate Report and/or download it as xls.
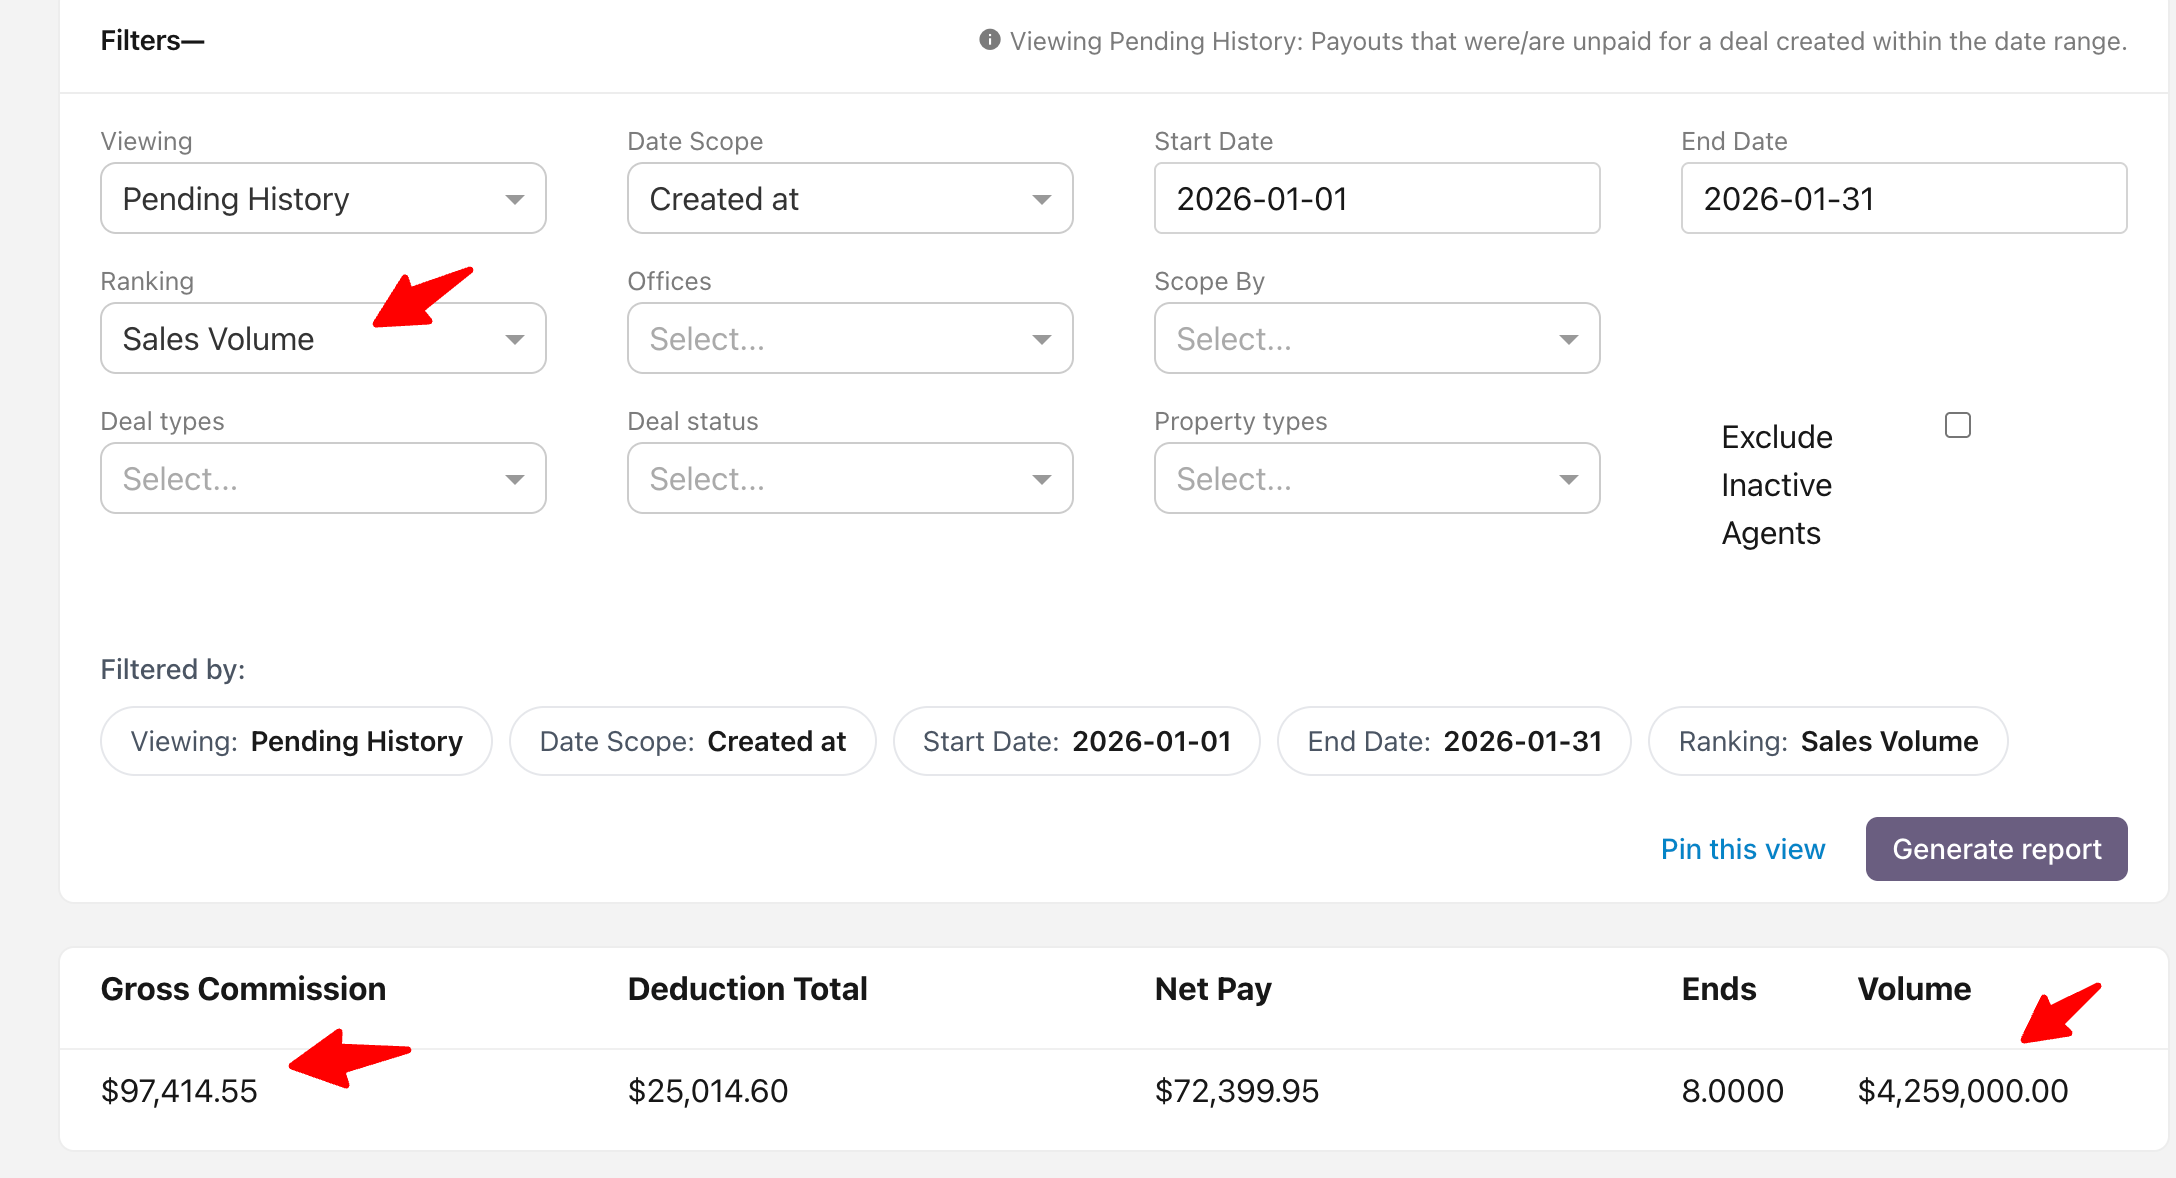
- Gross Commission: $97,414.55 (including tax)
- Agent GCI (before tax): $92,775.77, also as shown in the XLS download (Column F - total commissions)
- Deal Count: 6 unique deals (Column R - Full Deal Number)
- Sales Volume: $4,259,000 (unpaid deal volume, Column H - List Volume plus Column J - Sell Volume)
- Deduction Total: $25,014.60 (Column Q - Deduction Income)
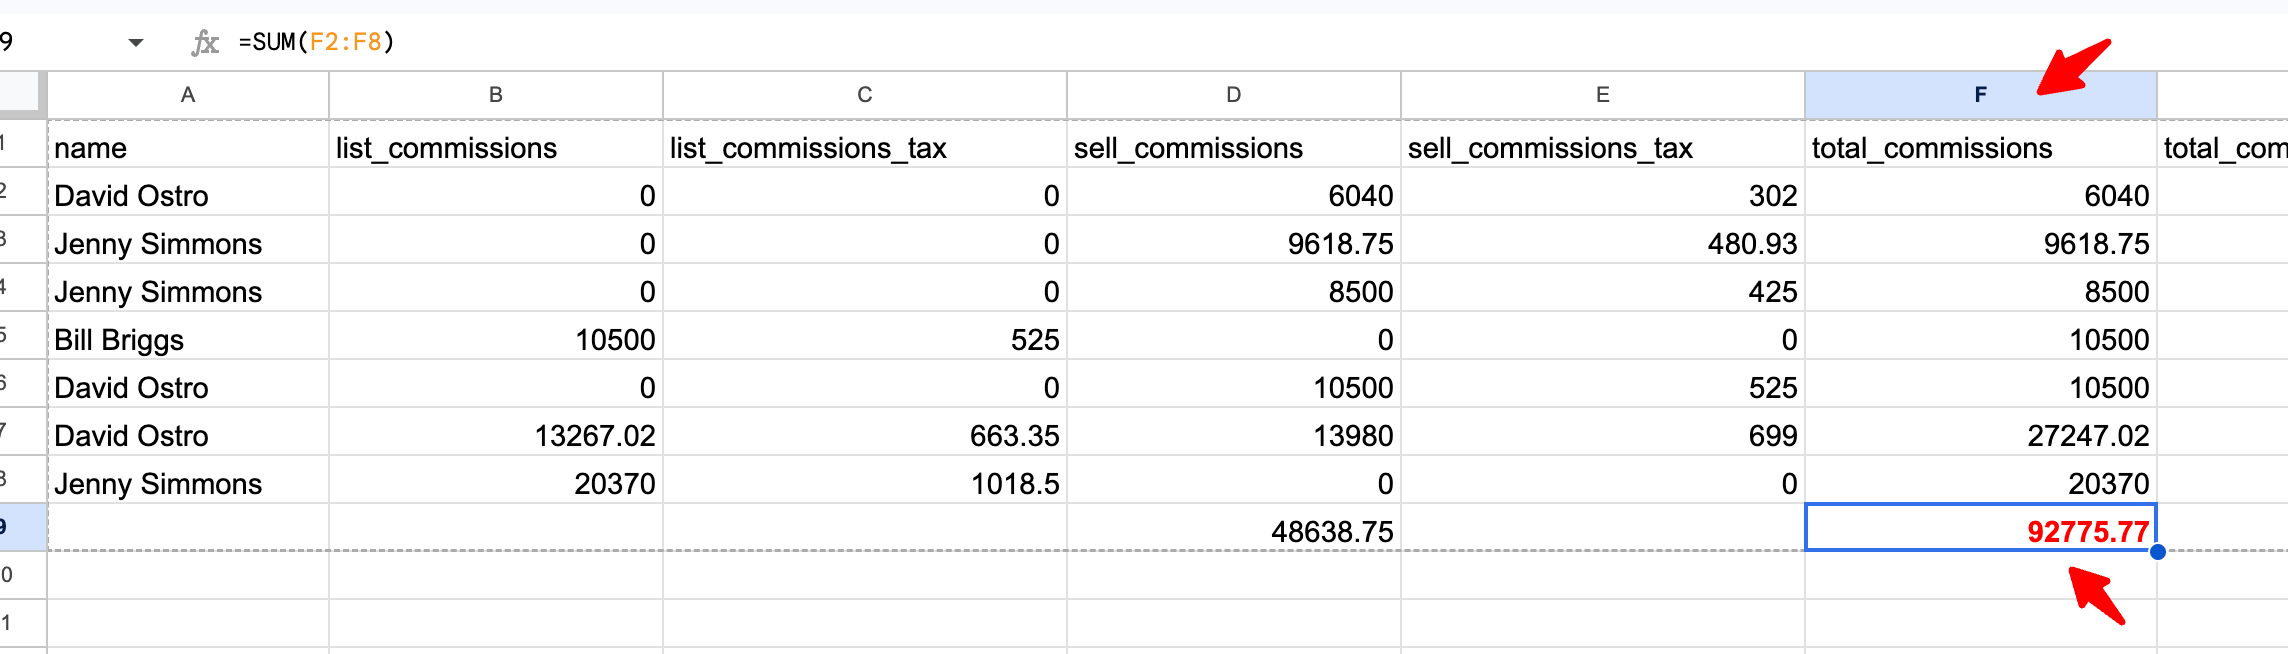 Step 3: Now run a second Performance Report for closed deal data
Viewing - Completed
Date Scope - Transacted at in January Ranking - Sales Volume
This will include all Paid data for deals closed in January.
Date Scope - Transacted at in January
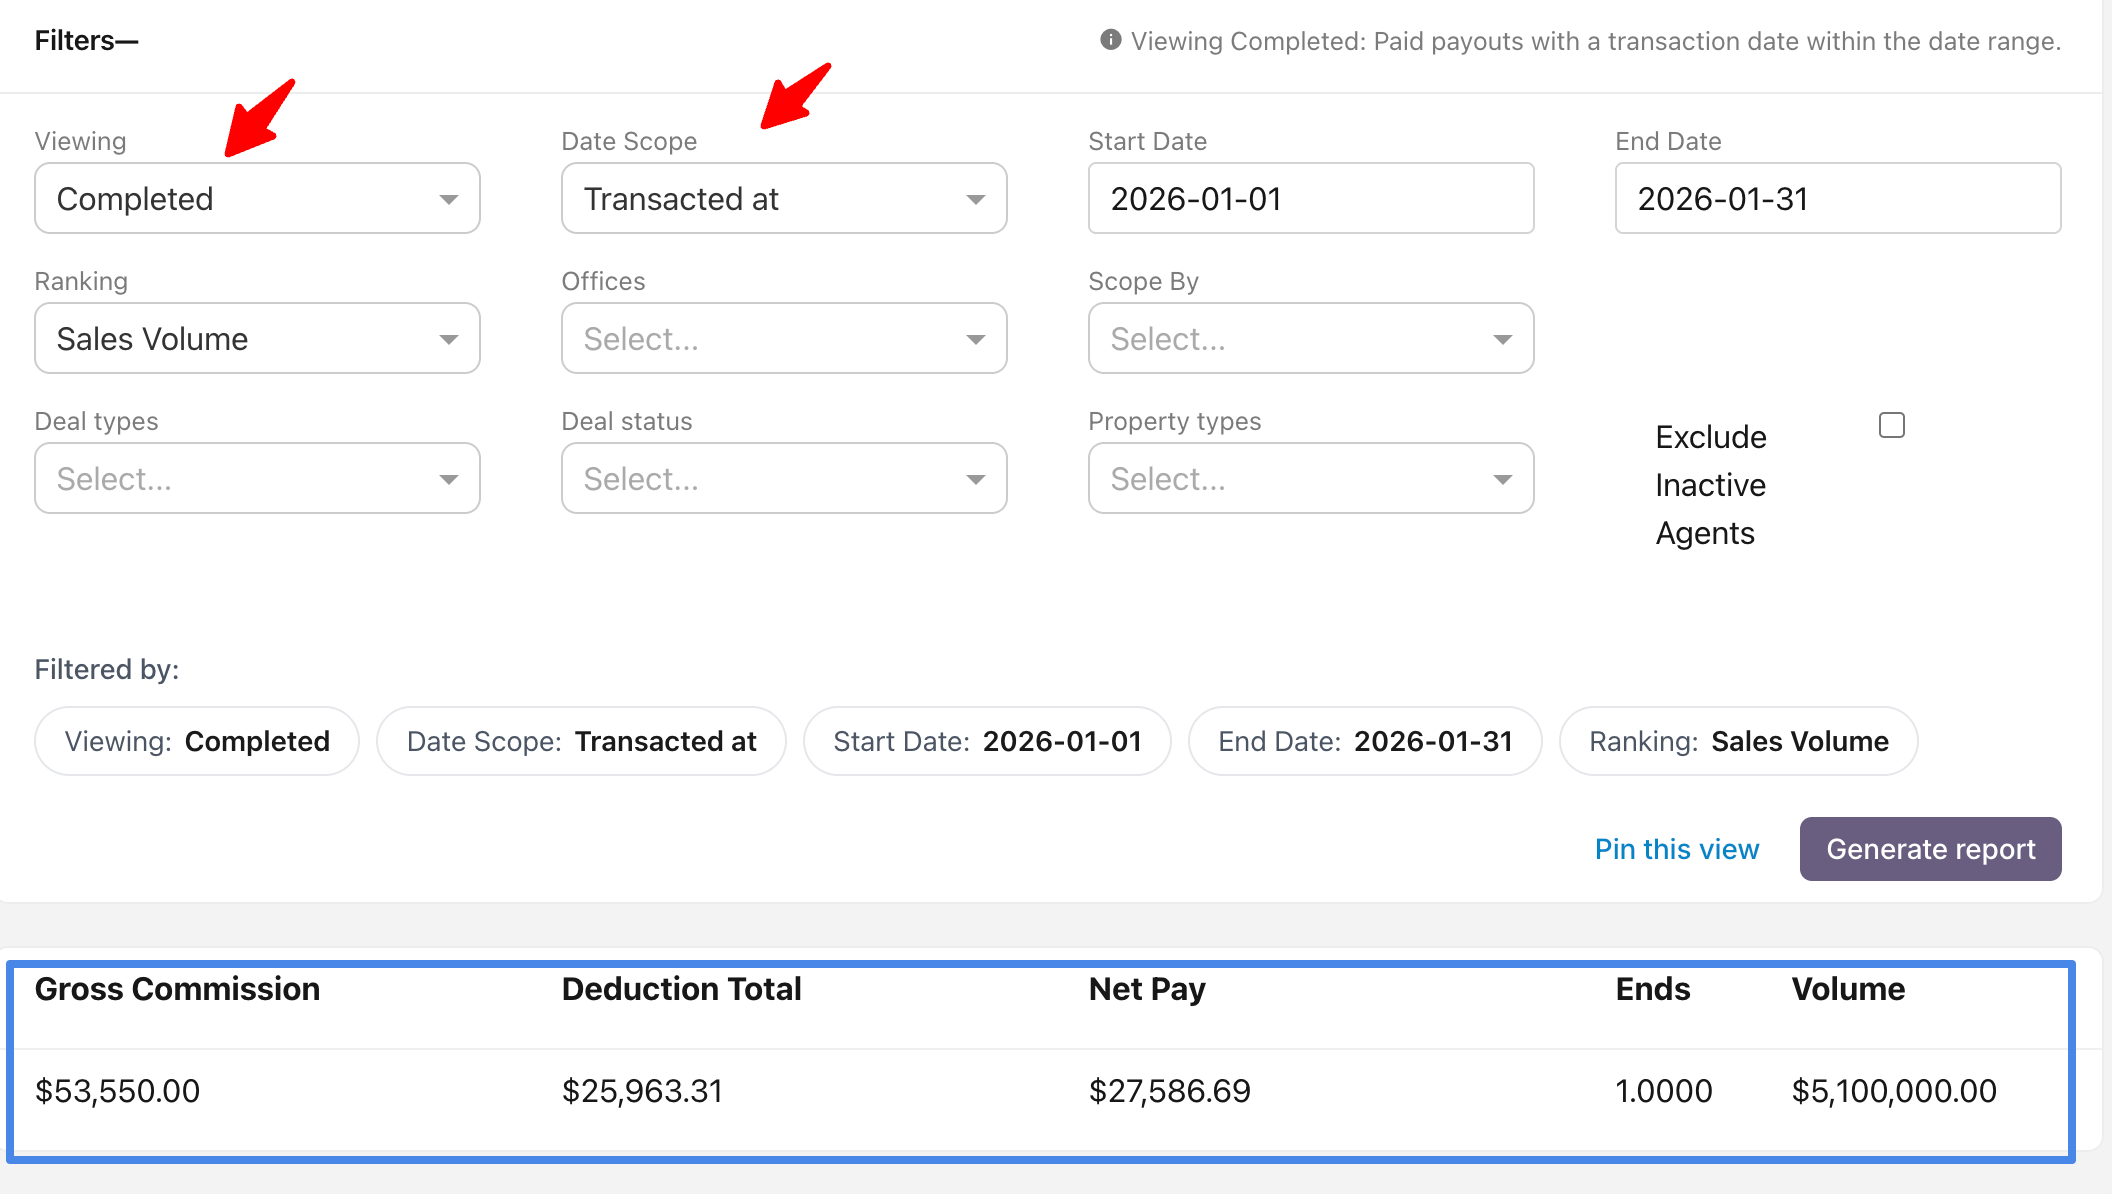
From the Generate Report view, it shows:- Gross Commission: $53,550 (including tax - 5% in this example)
- Agent GCI (before tax): $51,000, also as shown in the XLS download (Column F - total commissions)
- Deal Count: 1 unique deals (Column R - Full Deal Number)
- Sales Volume: $5,100,000 (closed paid deal volume, Column H - List Volume plus Column J - Sell Volume)
- Deduction Total: $25,963.31 (Column Q - Deduction Income)
- When combined, the two Performance Reports should match the Data Studio metrics for all deals written in January.
📈 Side-by-Side Comparison
- Gross Commission: $53,550 (including tax - 5% in this example)
- Agent GCI (before tax): $51,000, also as shown in the XLS download (Column F - total commissions)
- Deal Count: 1 unique deals (Column R - Full Deal Number)
- Sales Volume: $5,100,000 (closed paid deal volume, Column H - List Volume plus Column J - Sell Volume)
- Deduction Total: $25,963.31 (Column Q - Deduction Income)
- When combined, the two Performance Reports should match the Data Studio metrics for all deals written in January.
| Metrics | Data Studio | Loft Performance Report (written + close) | Result | Notes |
Deal Counts | 7 | 7 = 6 + 1 | ✅match | |
Sales Volume | 9,359,000 | 9,359,000 = $4,259,000 + 5,100,000 | ✅match | Data Studio counts the sales volume for both side agents on agent double-end and office double-end deals, which may result in higher sales volume totals compared to reports that count each deal only once. |
| Agent GCI | 143,775.77 | 143,775.77 = $92,775.77 + 51,000 | ✅match | |
Company Income | 47,499 | 49,443.52 ( $24,249.52 + $25,194) | Spot Check | Only deductions with the Income deduction type are included in Data Studio report. If there is a discrepancy, you will need to spot-check the deals individually to determine whether it is caused by a different deduction type being used. |
%GCI | 33.04% |
1. Business Overview - Closed and 7. Closed Report
This validation compares closed deal data between Data Studio Report and Loft Performance Report for the month of January.
Step 1: run Data Studio Report - Jan closed deal data shown as below
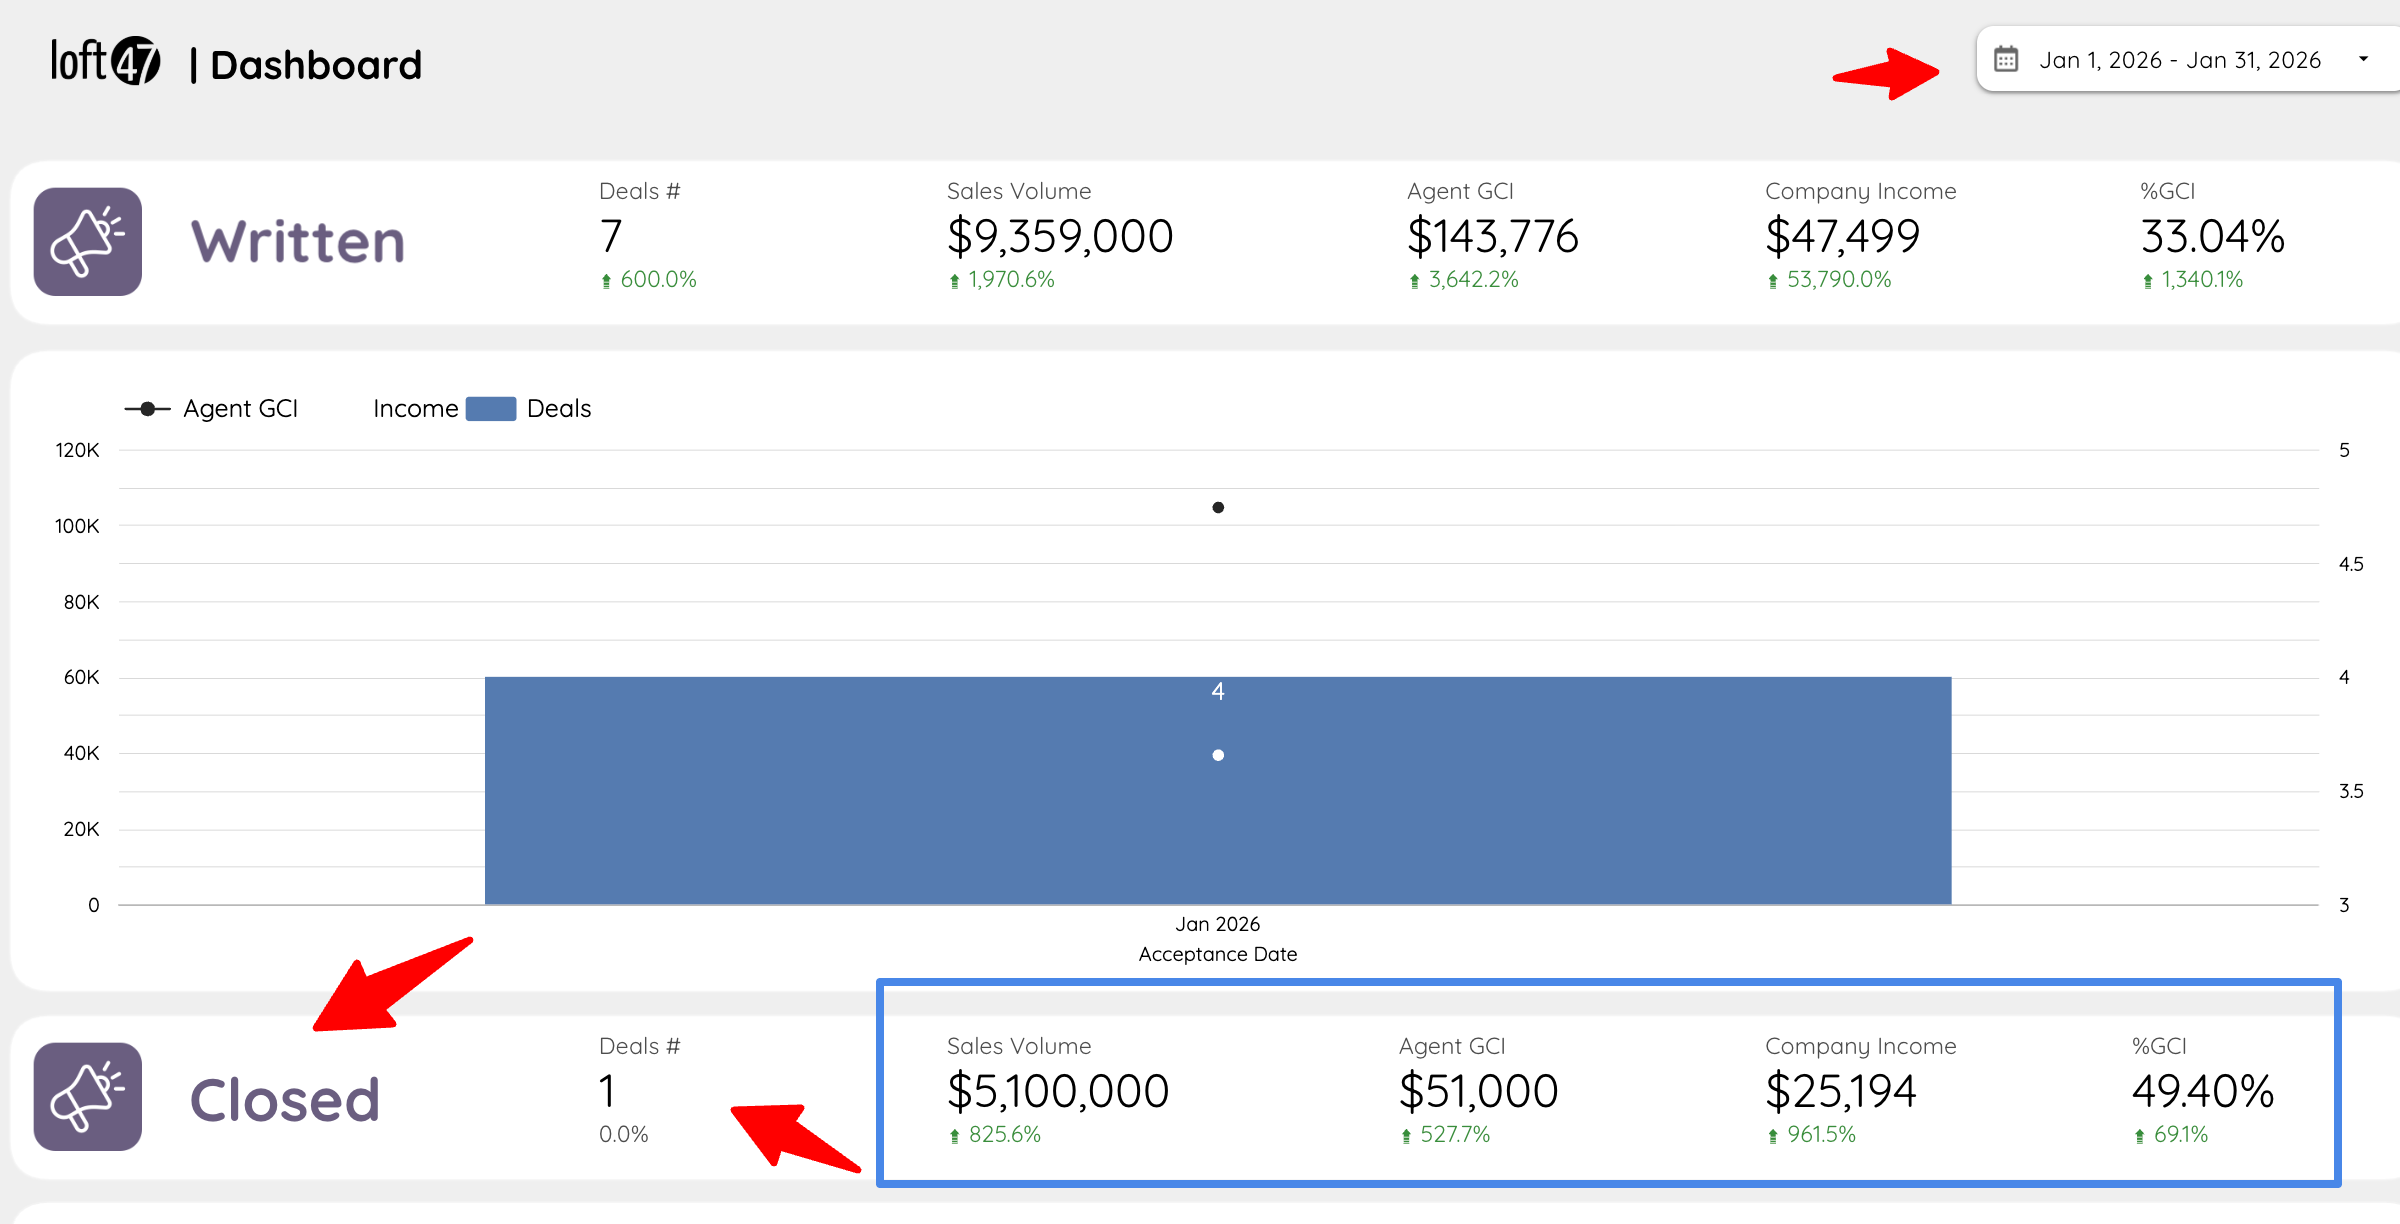
In Data Studio > #7. Closed Report > Export Data
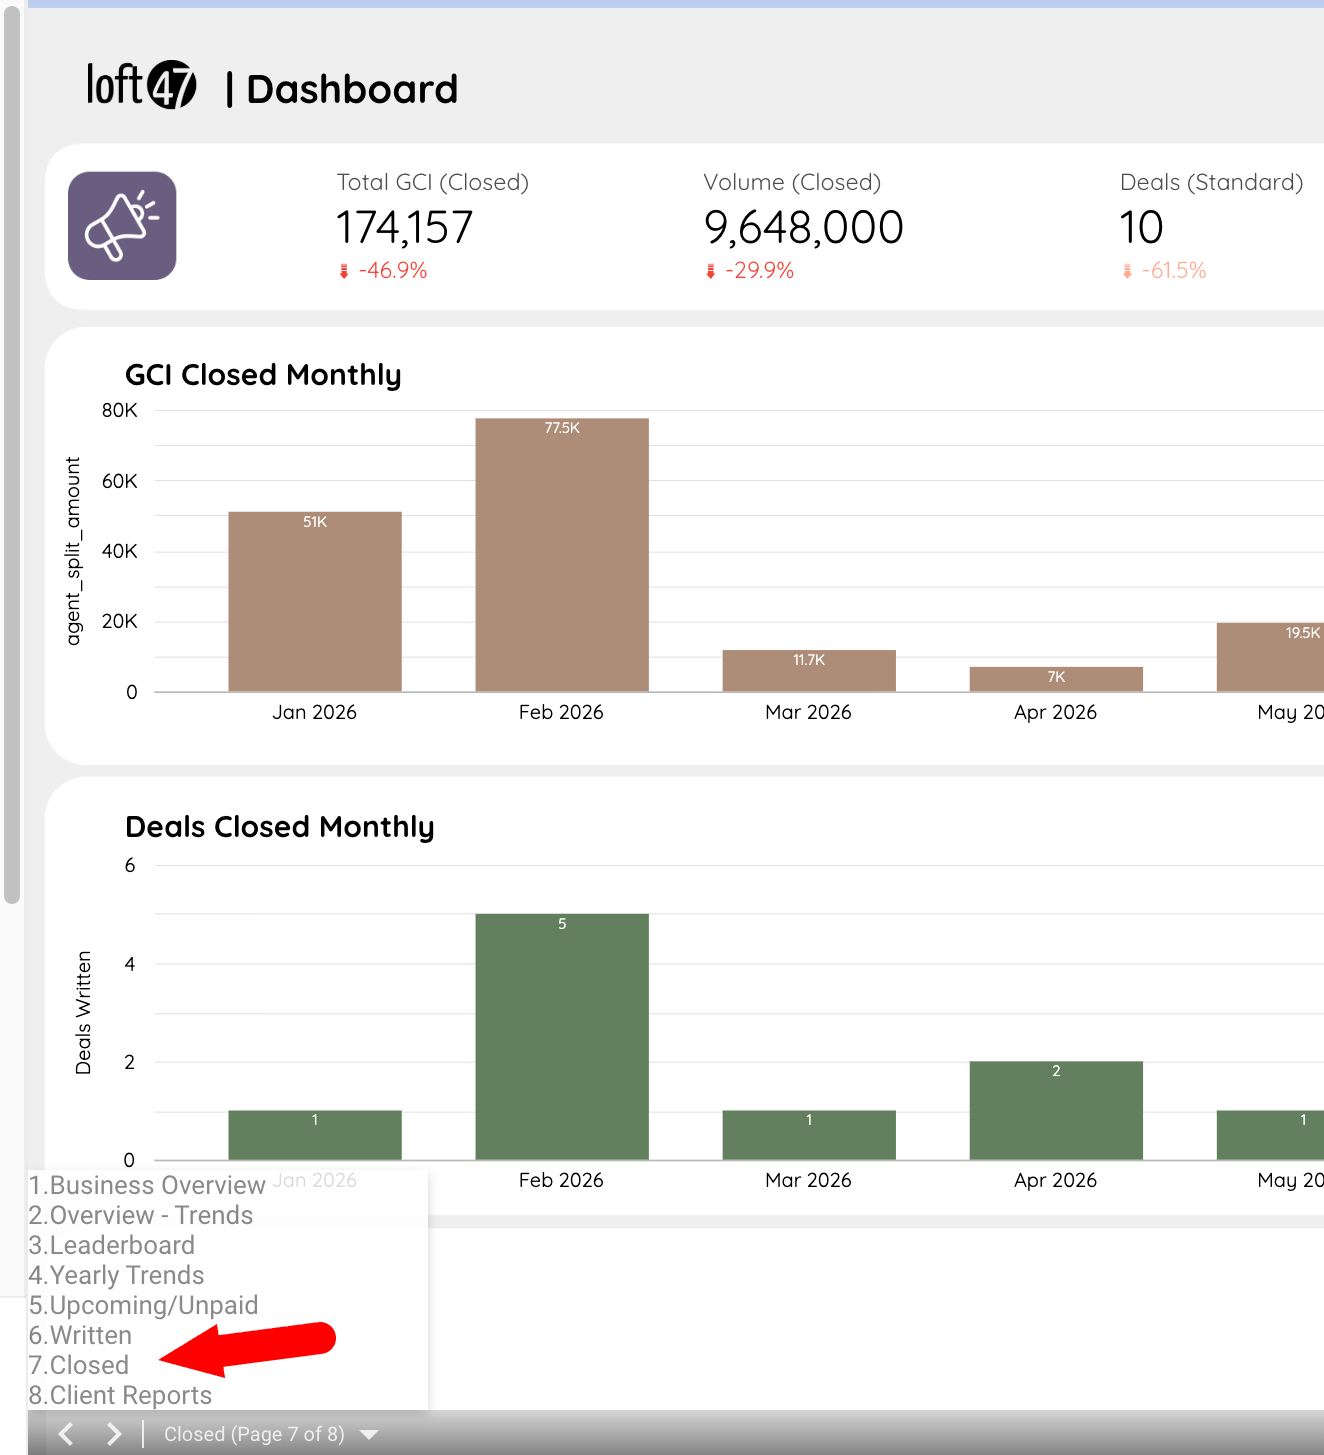
Step 2: Generate Loft Performance Report for transacted at deals in January
Viewing - Complete
Date Scope - Transacted at January
Ranking - Sales Volume
This will include all paid data for deal transacted at in January.
This will include all paid data for deal transacted at in January.
Performance Report Export
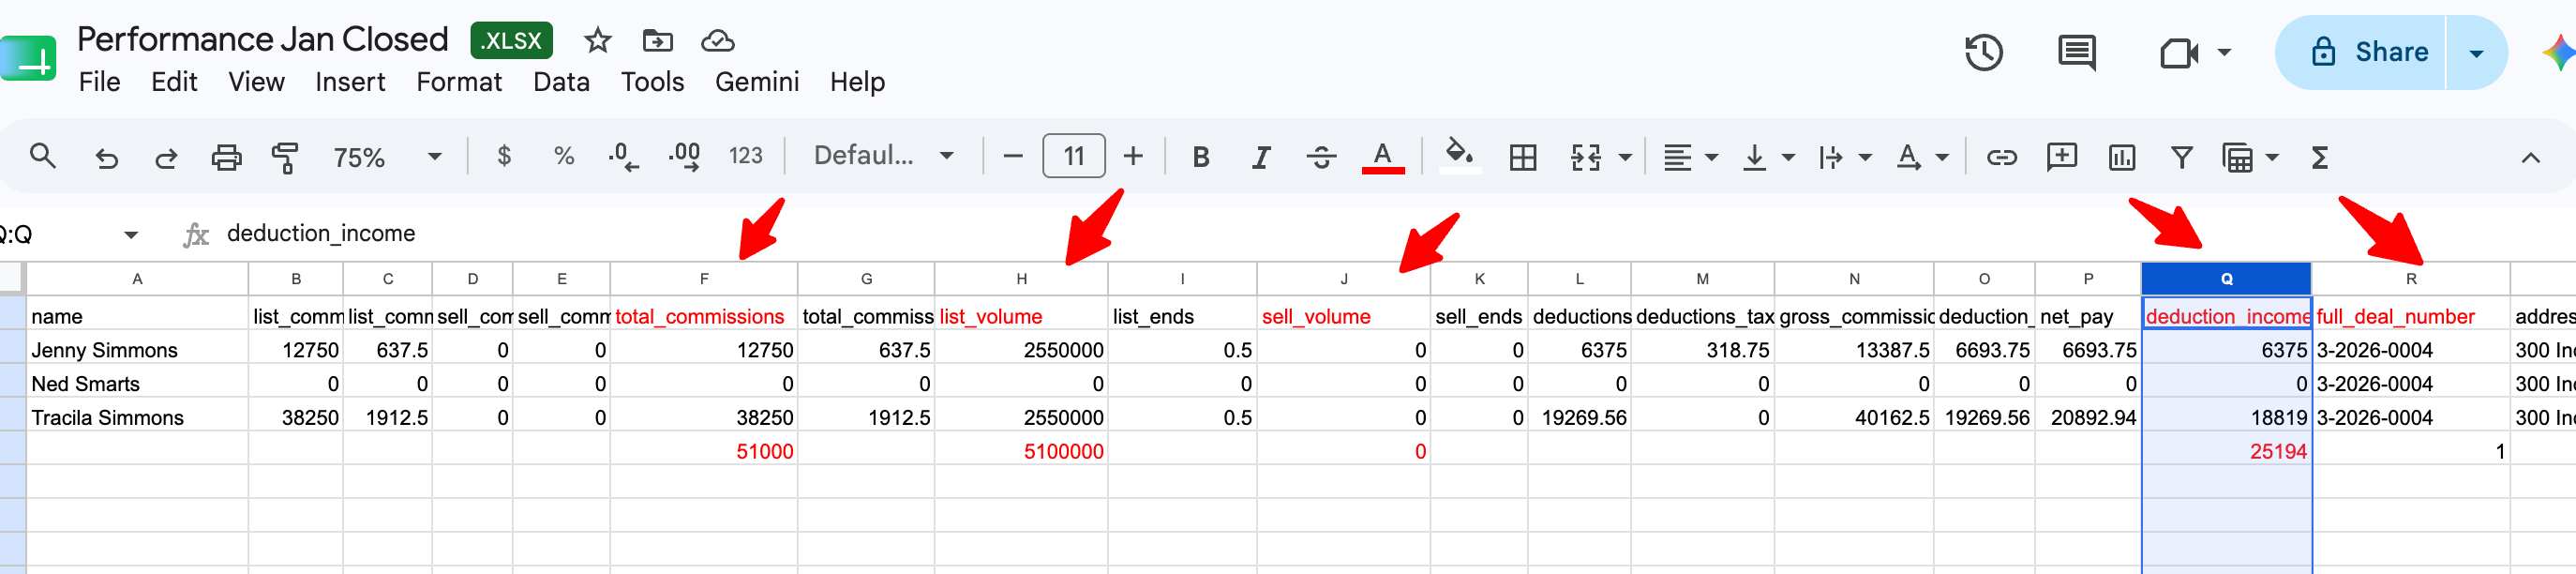 From the Generate Report view, it shows:
- Gross Commission: $53,550 (including tax - 5% in this example)
- Agent GCI (before tax): $51,000, also as shown in the XLS download (Column F - total commissions)
- Deal Count: 1 unique deals (Column R - Full Deal Number)
- Sales Volume: $5,100,000 (closed paid deal volume, Column H - List Volume plus Column J - Sell Volume)
- Deduction Total: $25,963.31 (Column Q - Deduction Income)
📈 Side-by-Side Comparison
Item Data Studio Loft Performance Report Result Notes 📌 Deal Counts 1 1 ✅match
💰 Sales Volume 5,100,000 5,100,000(Column H+J) ✅match Data Studio includes Agent Double End and Office Double End sales volume. 🧑💼 Agent GCI 51,000 51,000(Column F) ✅match
🏢 Company Income 25,194 $25,194 (Column Q)
✅match Only Income Type Deductions are included in Data Studio Report.
📊 % GCI 49.4% 49.4% ✅match % (Company Income ÷ Agent GCI)
- Gross Commission: $53,550 (including tax - 5% in this example)
- Agent GCI (before tax): $51,000, also as shown in the XLS download (Column F - total commissions)
- Deal Count: 1 unique deals (Column R - Full Deal Number)
- Sales Volume: $5,100,000 (closed paid deal volume, Column H - List Volume plus Column J - Sell Volume)
- Deduction Total: $25,963.31 (Column Q - Deduction Income)
🔑 Key notes: Deduction Type Changes and Historical Reporting
When validating Company Income between Data Studio and the Performance Report, keep the following in mind:✅Company Income (Column Q in Performance Report) includes Income-type deductions only.
🔄 If a deduction type is changed (for example, from Standard to Income) after a deal has closed, historical reports will use the current deduction type. Loft does not retain the deduction type that existed when the deal closed.
💰 Changing a deduction's type does not recalculate the deduction amount or affect any deduction dependencies on closed deals.
⏳ Data Studio may not reflect the change immediately. Once refreshed, it should match the Performance Report and use the current deduction type.
When validating Company Income between Data Studio and the Performance Report, keep the following in mind:
- Sales Volume
- Deal Count
- Agent GCI
- Company Income (Deduction Income)
- Sales Volume
- Agent GCI
You can also right click on the Data Studio view to "Export Chart" to see it in xls version.
- Sales Volume
- Agent GCI
- Deal Count
The following example validates the projected payouts for Firm deals closing in June 2026.
- Close Date: June 1, 2026 – June 30, 2026
- Sale Status: Firm
- Value to Validate: Payout Remaining
* Data Studio export displays: 17 deals and Net Pay:: $361,244.92
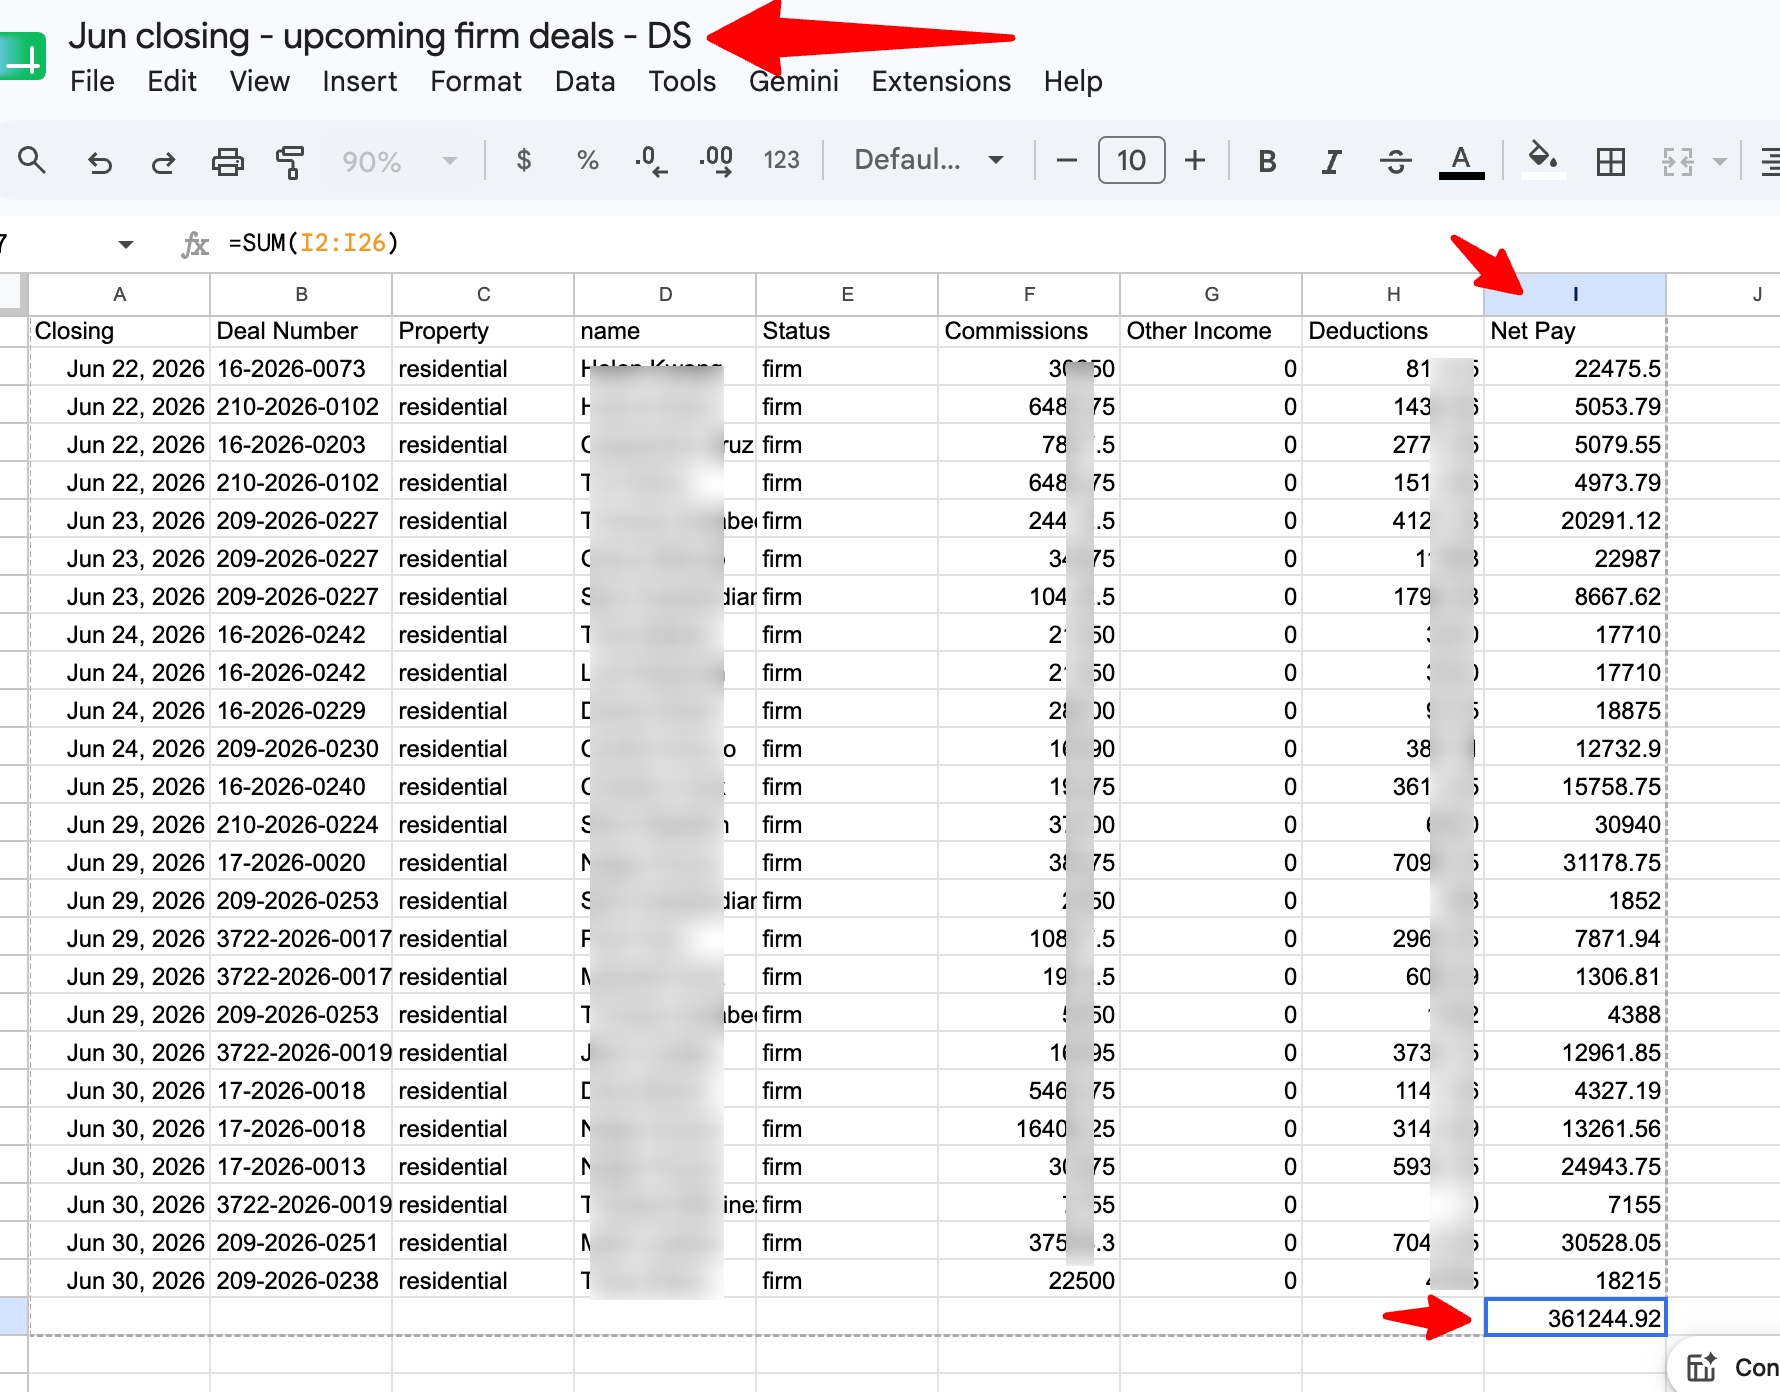
matches Deal filtered Report - 17 deal and Column AM - Payout Remaining $361,244.92. 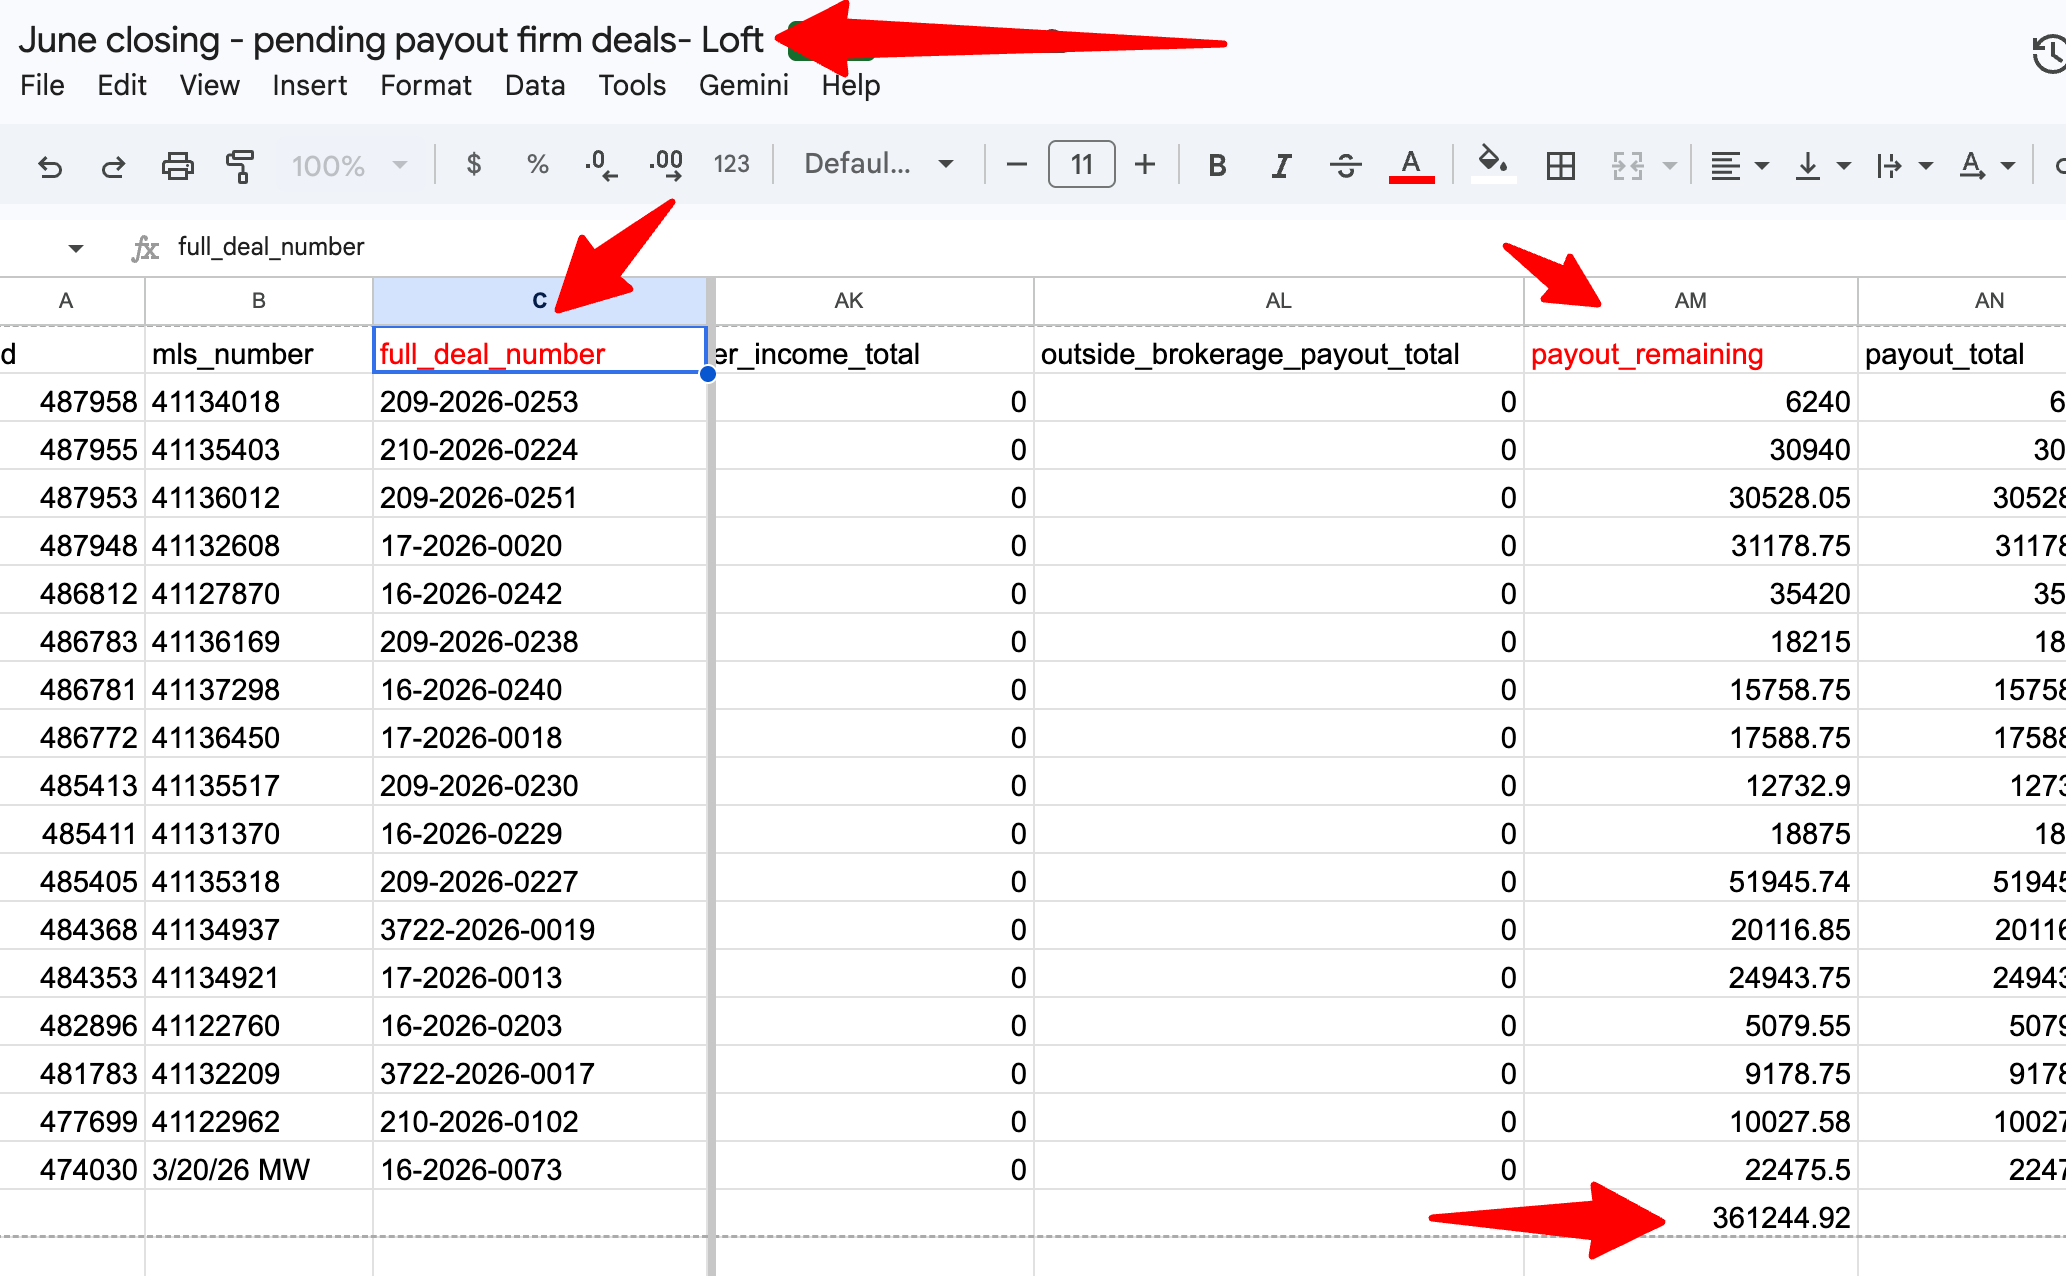
This confirms that the Upcoming/Unpaid Report accurately reflects the projected unpaid commission amounts for Firm deals within the selected closing date range in Loft.
🔑 Key Note When validating Remaining Payout by work state, keep the following difference in mind:
This confirms that the Upcoming/Unpaid Report accurately reflects the projected unpaid commission amounts for Firm deals within the selected closing date range in Loft.
🔑 Key Note
- ✅ Deals Report: The Payout Remaining filter returns only transactions with a positive remaining payout amount.
- 📊 Data Studio – Upcoming/Unpaid Report: Includes all Firm (Upcoming/Unpaid) deals, including those with positive, zero, and negative remaining payout amounts.
💡 Tip: If your deal count doesn't match between the two reports, check whether any Firm deals have a zero or negative remaining payout, as these are included in the Data Studio report but excluded by the Payout Remaining filter in the Deals Report.
6. Written Reports and 7. Closed Reports
Please refer to #1 Business Overview above, as it's the data studio report export feature for written and closed data.
8. Client Reports
| The Client Reports provide a spreadsheet-style view of sales activity by deal and agent for a selected date range, making it easy to review and validate transaction data. |
This report is useful for reviewing deal activity, validating sales data, and comparing report results across Loft47 and external reporting tools.